ILLUSTRATIVE DEAL — Fictional educational example. Not a real property or transaction. All figures hypothetical.
Deal Breakdown
Anatomy of a Neighborhood Center
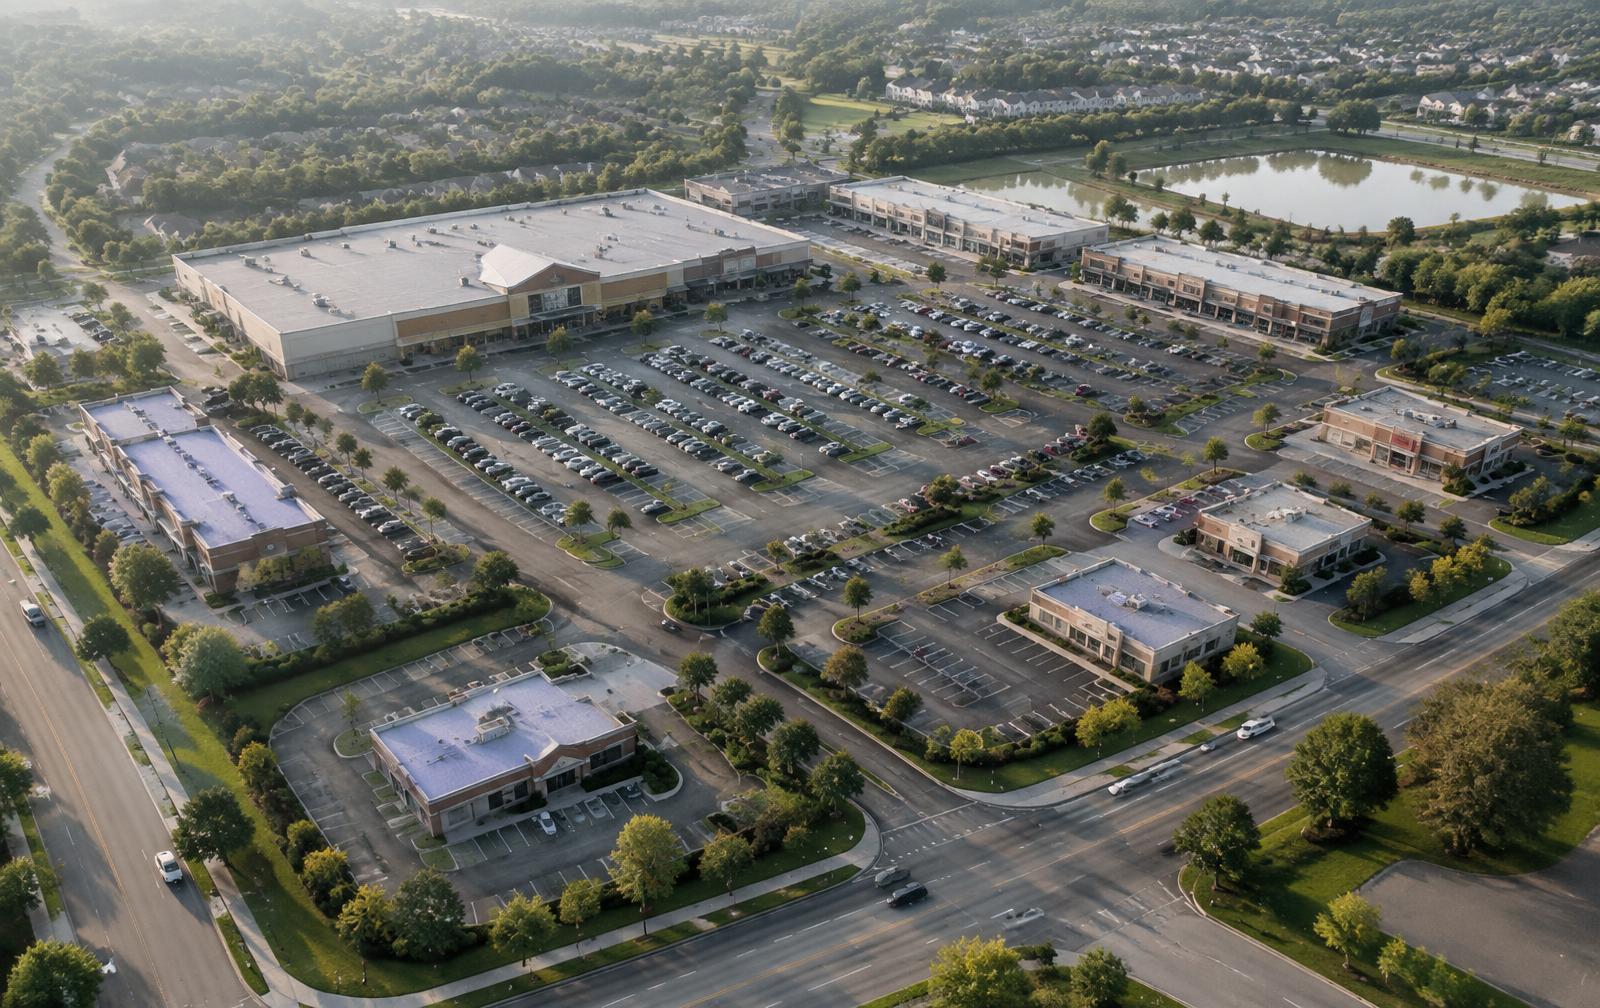
- Property
- “Meadow Crossing” (fictional)
- Location
- Hypothetical suburban corridor
- Property Type
- Grocery-anchored neighborhood center
- Size
- 80,000 SF
- Tenant Mix
- Grocery anchor, pharmacy, 12 shop spaces, 2 pads
- Sale Price
- $20,000,000
- Price / SF
- $250
- NOI
- $1,400,000
- Cap Rate
- 7.00%
- Occupancy
- 92%
Check: $1,400,000 ÷ $20,000,000 = 7.00%
Lease Considerations
The anchor has a long remaining term but below-market rent. Several shop leases expire within three years, creating both rollover risk and an opportunity to mark rents to market. Some shop leases include co-tenancy clauses tied to the anchor.
Financing
Assume a 60% loan-to-value loan ($12,000,000) at a hypothetical 6.5% rate on 25-year amortization — roughly $81,000 per month, or $972,000 per year in debt service. Debt service coverage: $1,400,000 ÷ $972,000 ≈ 1.44x.
Investment Thesis
Necessity-based anchor drives recurring trips; vacant shop space and near-term rollover offer upside if leased at market.
Key Risks
Anchor dependence and co-tenancy exposure; leasing velocity on vacant space; capital needs for roof and parking; interest rate risk at refinance or exit.
What Makes It Interesting
The headline cap rate understates the story. Value depends on whether the buyer can lease vacancies and renew shop tenants — the classic tradeoff between in-place income and execution risk.